
How to Buy a Robotic Coffee Bar in 2026?
Buying a Robotic Coffee Bar in 2026 requires more than comparing prices and glossy demonstrations. It is a business decision involving equipment, software, staffing, permits, maintenance, and customer expectations. A machine may pour a precise espresso, yet still struggle during a morning rush. That difference matters.
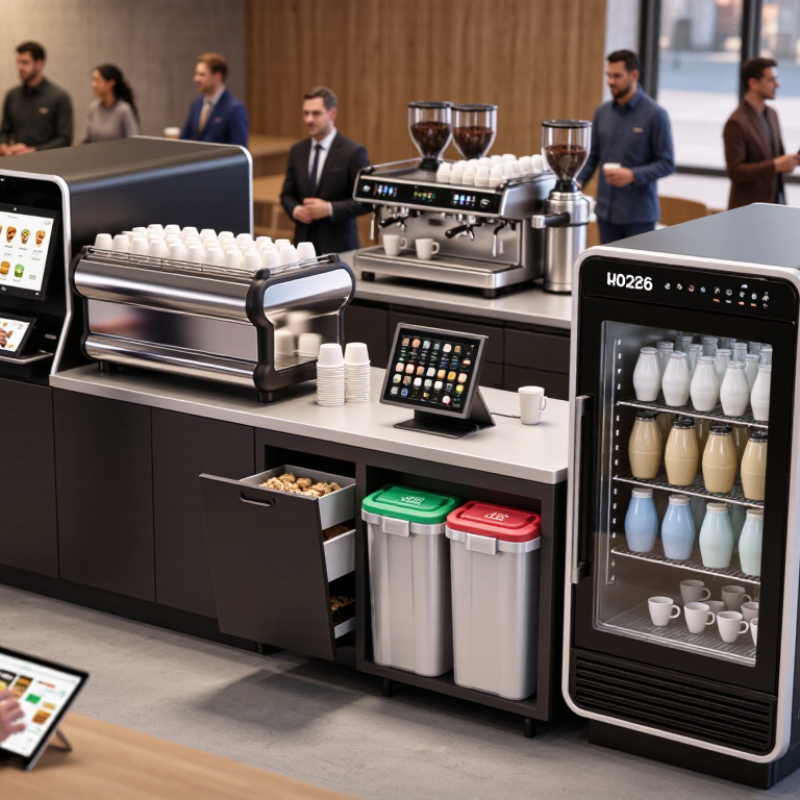
This guide explains how to assess robotic coffee systems before signing a purchase agreement. It examines drink capacity, brewing quality, installation requirements, payment integration, cleaning routines, and remote technical support. Look closely at the espresso group, milk refrigeration, cup storage, and waste collection area. These small components can determine whether the bar operates smoothly or becomes an expensive bottleneck.
Reliable suppliers should provide performance data from comparable locations. Ask for service response times, warranty limits, replacement part availability, and documented operator training. Request a live demonstration, not only a polished video. Watch how the system handles an incorrect order, an empty milk container, or a network interruption.
Real-world testing reveals weaknesses.
Costs also deserve careful reflection. A lower purchase price may hide expensive installation, software subscriptions, or frequent maintenance visits. Conversely, the most advanced system may exceed the needs of a small café, hotel, office, or transport hub. Local regulations, electrical capacity, food-safety procedures, and accessibility requirements must be confirmed with qualified professionals.
No robotic system is entirely hands-free. Staff still need to monitor hygiene, restock ingredients, assist customers, and respond to failures. That inconvenient truth should shape your budget and operating plan. The right purchase balances automation with dependable human oversight. It should improve service without creating a fragile, costly spectacle.
Define Demand Using the NCA’s 67% U.S. Past-Day Coffee Rate
How to Buy a Robotic Coffee Bar in 2026?
The National Coffee Association reports that 67% of U.S. adults drank coffee the previous day. This figure gives buyers a practical demand signal for 2026. It does not guarantee sales at every location. A robotic coffee bar needs steady foot traffic, repeat customers, and reliable service hours. Study commuter counts, nearby offices, hotel occupancy, and morning purchasing patterns before choosing equipment.
A strong site may produce 80 orders between 7:00 and 10:00 a.m. Test whether the machine can handle that volume without delays. Measure drink preparation time, cleaning needs, refill frequency, and payment failures. Ask suppliers for service records, replacement-part timelines, and staff training requirements. A polished interface means little if the system stops beside a crowded train entrance.
Start with a limited menu and clear customer instructions. Milk storage, cup sizes, temperature controls, and allergen information require careful planning. The 67% rate shows broad coffee demand, but it does not reveal preferred drinks or local price limits. Run a small pilot whenever possible. I would also budget for human support, even with advanced automation. My first estimate might be too optimistic. Demand can look strong on paper and still weaken during holidays, rain, or equipment downtime.
| Demand Dimension | Verified Value or Planning Input | What the Data Indicates | Robotic Coffee Bar Buying Implication | Data Classification |
|---|---|---|---|---|
| U.S. adults drinking coffee on the past day | 67% | Approximately two out of every three U.S. adults reported drinking coffee on the previous day. | Use coffee participation as the primary demand-screening metric before estimating location-level sales. | Observed benchmark |
| Average coffee consumption among coffee drinkers | About 3 cups per day | Daily coffee drinkers reported an average consumption level of roughly three cups. | A high-frequency category supports repeat-purchase locations such as offices, transport hubs, campuses, hospitals, and mixed-use buildings. | Observed benchmark |
| Reference U.S. population base | 340,110,988 residents | The U.S. Census Bureau estimated the resident population at 340,110,988 on July 1, 2024. | Use current local population, worker population, student population, or visitor counts instead of applying the national total directly to a site. | Official statistic |
| National coffee participation proxy | 67% of the selected adult catchment | For a site with a verified adult catchment of 10,000 people, the participation proxy equals approximately 6,700 potential past-day coffee consumers. | Start with the adult catchment, then reduce the estimate using access, opening hours, price, competition, and repeat-visit assumptions. | Calculated planning proxy |
| Daily demand conversion example | 6,700 × visit-rate assumption | If only 5% of the 6,700-person coffee-participation proxy purchases from the installation on a given day, the result is approximately 335 transactions. | Use several conversion cases—low, base, and high—rather than treating the 67% rate as guaranteed machine sales. | Scenario calculation |
| Peak-period concentration | Measure by 15-minute intervals | National participation data does not identify a specific site’s rush-hour pattern; local observation is required. | Request transaction forecasts by 15-minute interval and size the brewer, grinder, refrigeration, payment system, and pickup area around peak demand. | Site validation required |
| Operating-day requirement | Separate weekday and weekend demand | A national past-day rate does not distinguish workdays, weekends, holidays, or seasonal traffic. | Buy equipment only after reviewing at least two representative weekday observations and one weekend or low-traffic period where applicable. | Site validation required |
| Menu breadth | Track coffee and non-coffee demand separately | The 67% figure measures coffee participation, not demand for every beverage category or recipe type. | Evaluate whether the robotic bar can handle espresso-style drinks, brewed coffee, iced beverages, milk alternatives, customization, and non-coffee orders without reducing throughput. | Product planning |
| Service and uptime requirement | Plan around demand during all advertised hours | Participation does not measure equipment uptime, replenishment time, cleaning time, payment failures, or technical support response. | Compare guaranteed uptime, remote monitoring, preventive maintenance, ingredient replenishment, cleaning procedures, and manual override capability before purchase. | Procurement criterion |
| Financial decision threshold | Use site-specific break-even volume | National consumption data cannot establish rent, labor, utilities, ingredients, maintenance, payment fees, taxes, or financing costs for an individual location. | Approve the purchase only when conservative transaction volume and average gross profit cover fixed operating costs, maintenance, downtime, and equipment repayment. | Investment analysis |
Related Posts
-
How to Source a Coffee Robot Barista in 2026?
-
Ultimate Showdown of Top Coffee Machine Robots in 2023
-
Maximize Your Coffee Production Efficiency with the Ultimate Guide to Coffee Robot Machines
-
2026 Top Coffee Robot Machine Innovations and Trends?
-
How to Choose the Best Coffee Robot Machine for Your Home?
-
What is a Robot Coffee Kiosk and How Does it Work?